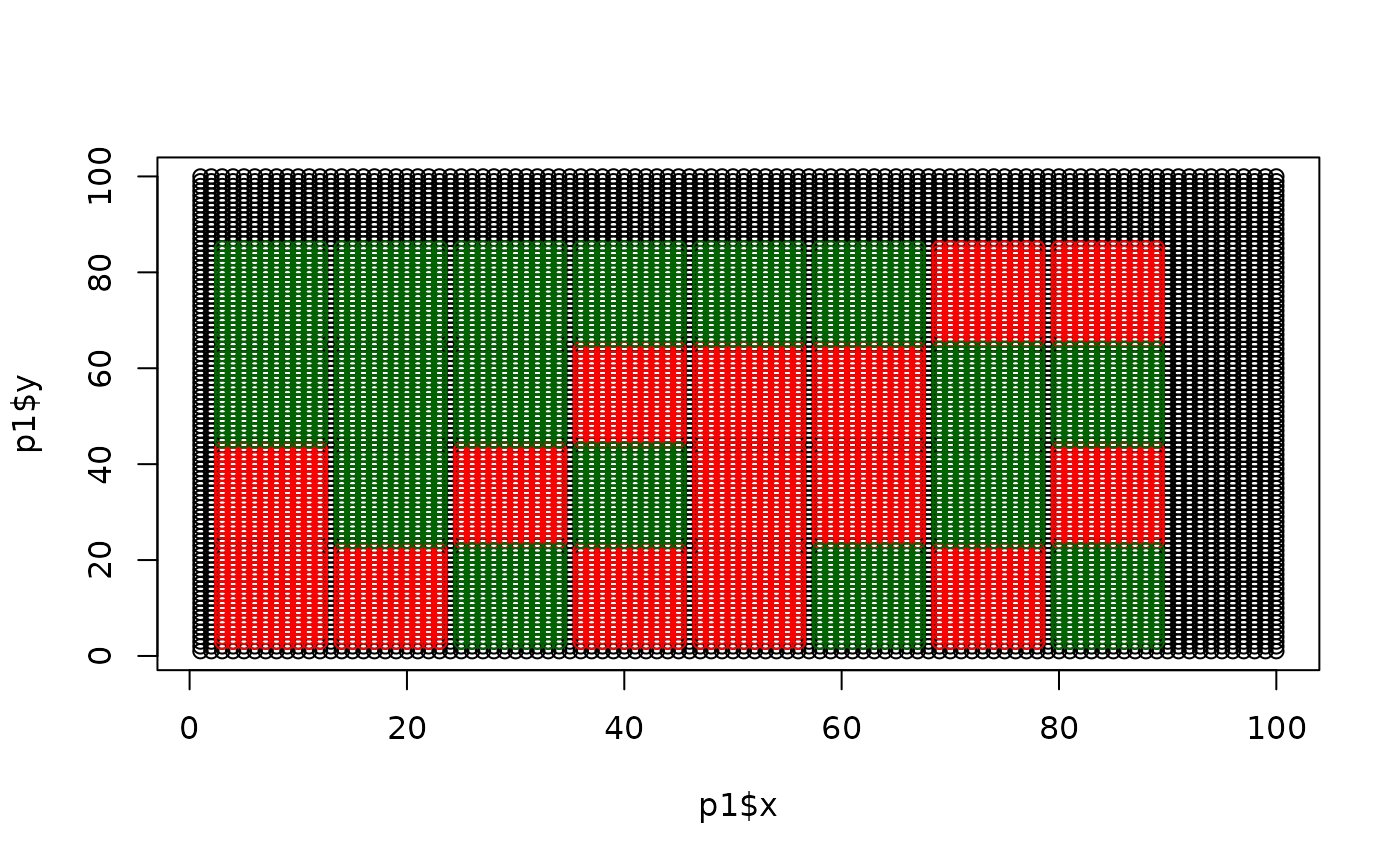
Create xyz data.frame with z plots
create_inf_xyz.RdCreates an xy data.frame and a z column load with a specified value in
paddock plots
Usage
create_inf_xyz(
  plot_length = 20,
  plot_width = 10,
  paddock_length = 100,
  paddock_width = 100,
  infected_plots = "random",
  n_plots = 15,
  infection_weight = 1,
  external_buffer_end = 2,
  external_buffer_adj = 2,
  internal_buffer_adj = 1,
  internal_buffer_end = 1,
  verbose = FALSE
)
Arguments
- plot_length
numeric, length of experimental plots in paddock (meters)
- plot_width
numeric, width of experimental plots in paddock (meters)
- paddock_length
numeric, length of paddock (meters)
- paddock_width
numeric, width of paddock (meters)
- infected_plots
numeric vector of plot numbers which are infected. Plot 1 starts in the corner and then are allocated across the width (x) of the paddock as plot numbers increase. Default is
"random"and will randomly assign infectedn_plotsin quantity.- n_plots
numeric, number of infected plots, used when infected_plots is specified as
"random"- infection_weight
the value applied to the z
loadcolumn of infected plots- external_buffer_end
numeric, length of buffers on the end of the paddock (meters)
- external_buffer_adj
numeric, length of buffers on the sides of the paddock (meters)
- internal_buffer_adj
numeric, length of buffers between plots adjacent to the row direction (meters)
- internal_buffer_end
numeric, length of buffers between plots ends in the row direction (meters)
- verbose
logical, if 'TRUE' function will return a message with total plots and extra length or width in meters